In an age where all businesses have shifted online, it cannot be denied that a LINE Official Account (LINE OA) has become an essential tool for brands big and small, serving as a convenient online communication channel through which promotions and product information can be directly sent to customers. Myriad other features to make an impression include personal messages, automated responses and points cards. Many brands have successfully utilized a LINE OA to expand their customer base and rapidly increase sales but these targets are just the beginning, with many businesses making plans to spur purchase orders and expand their base of followers ever wider. Would you believe that a well-designed LINE OA tailored to your customers’ needs can easily result in success?
Certainly, the most important part of designing a winning LINE OA is to first thoroughly understand your customers, which starts with analyzing basic data such as gender, age, career and location and progresses to analyzing insights that reveal their behaviors and preferences. Such data provides a direction for forming communication content that connects and presenting promotions aligned with a customer’s buying behavior. The question then is, where can we find such data?
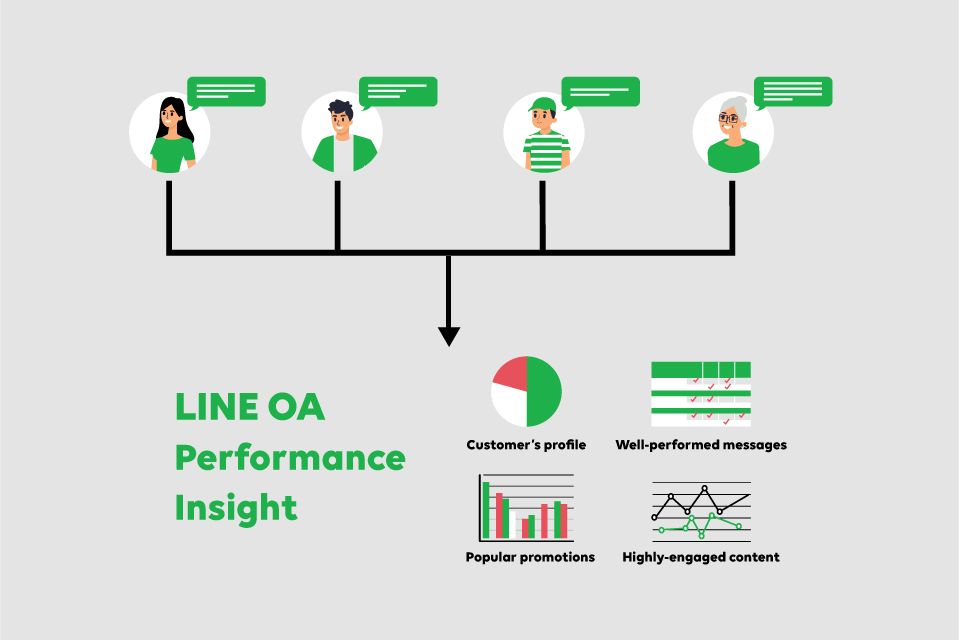
The answer is Performance Insight, a feature of LINE OA that reveals customer data and uncovers how to best meet their needs. Performance Insight displays fundamental data through to a customer’s behaviors with the LINE OA in simple, easy to understand graphs and charts. Let’s see what data LINE OA Performance Insight shows us and how it can be utilized:
Insight: Friends
Under this heading we see how many customers are following our LINE OA, their qualities and where they are from as follows:
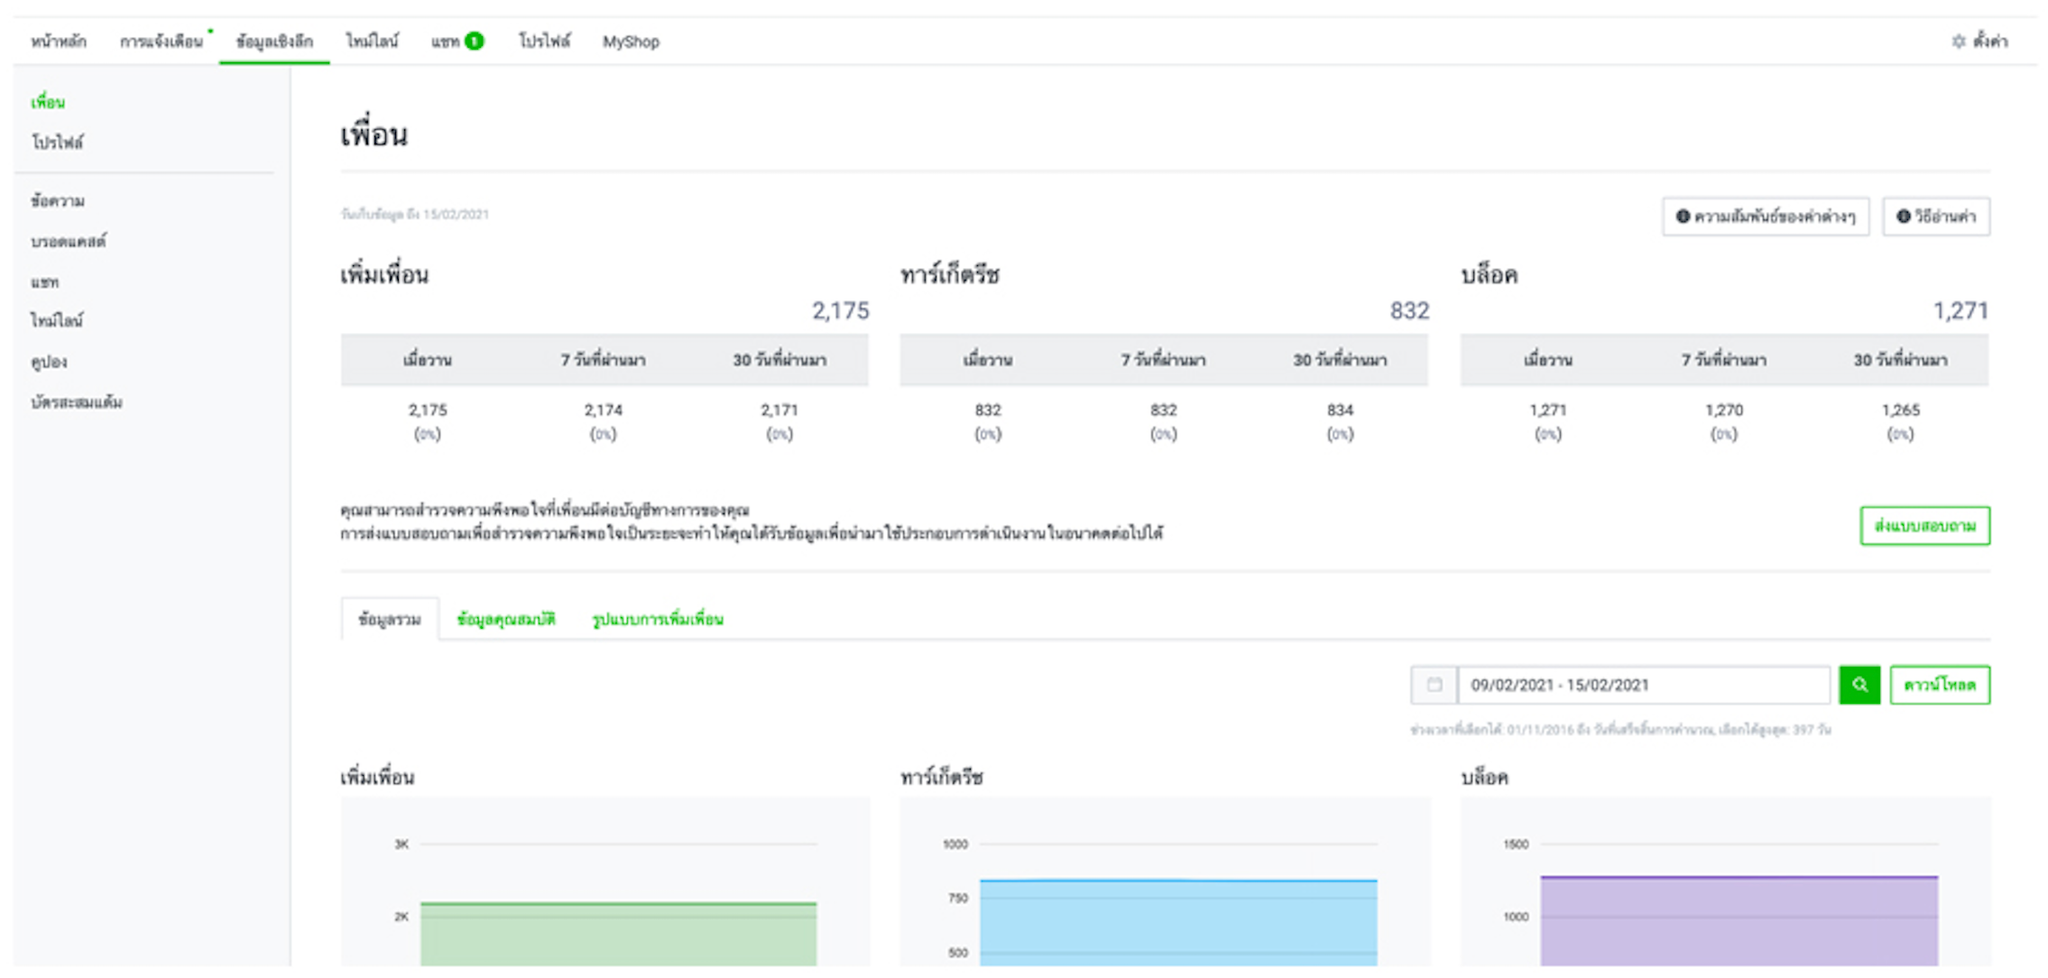
1. Data Overview
The data overview page displays the amount of customers in the LINE OA divided into the following three categories.
Target Reach category will see messages broadcast by the LINE OA. If the Target Reach number begins to fall or the Block number begins to rise, that is a signal to reconsider and adjust the LINE OA, asking “are broadcasts too frequent?” or “are these promotions attractive?”
2. Qualities
Apart from the number of customers, we can also view customer qualities through the Performance Insight Dashboard, which clearly displays customer genders, ages and locations. Displayed data is from 3 days prior and gives the brand an image of their target customer group.
3. Friend Adding
Through the Performance Insight Dashboard, we can clearly see what customers have added the LINE OA and from where, the QR Code, the Add Friend button or the webpage link. This helps to inform how to best promote the LINE OA to maximize reach and can also inform customer grouping for targeted broadcasts.
Insight: Broadcast
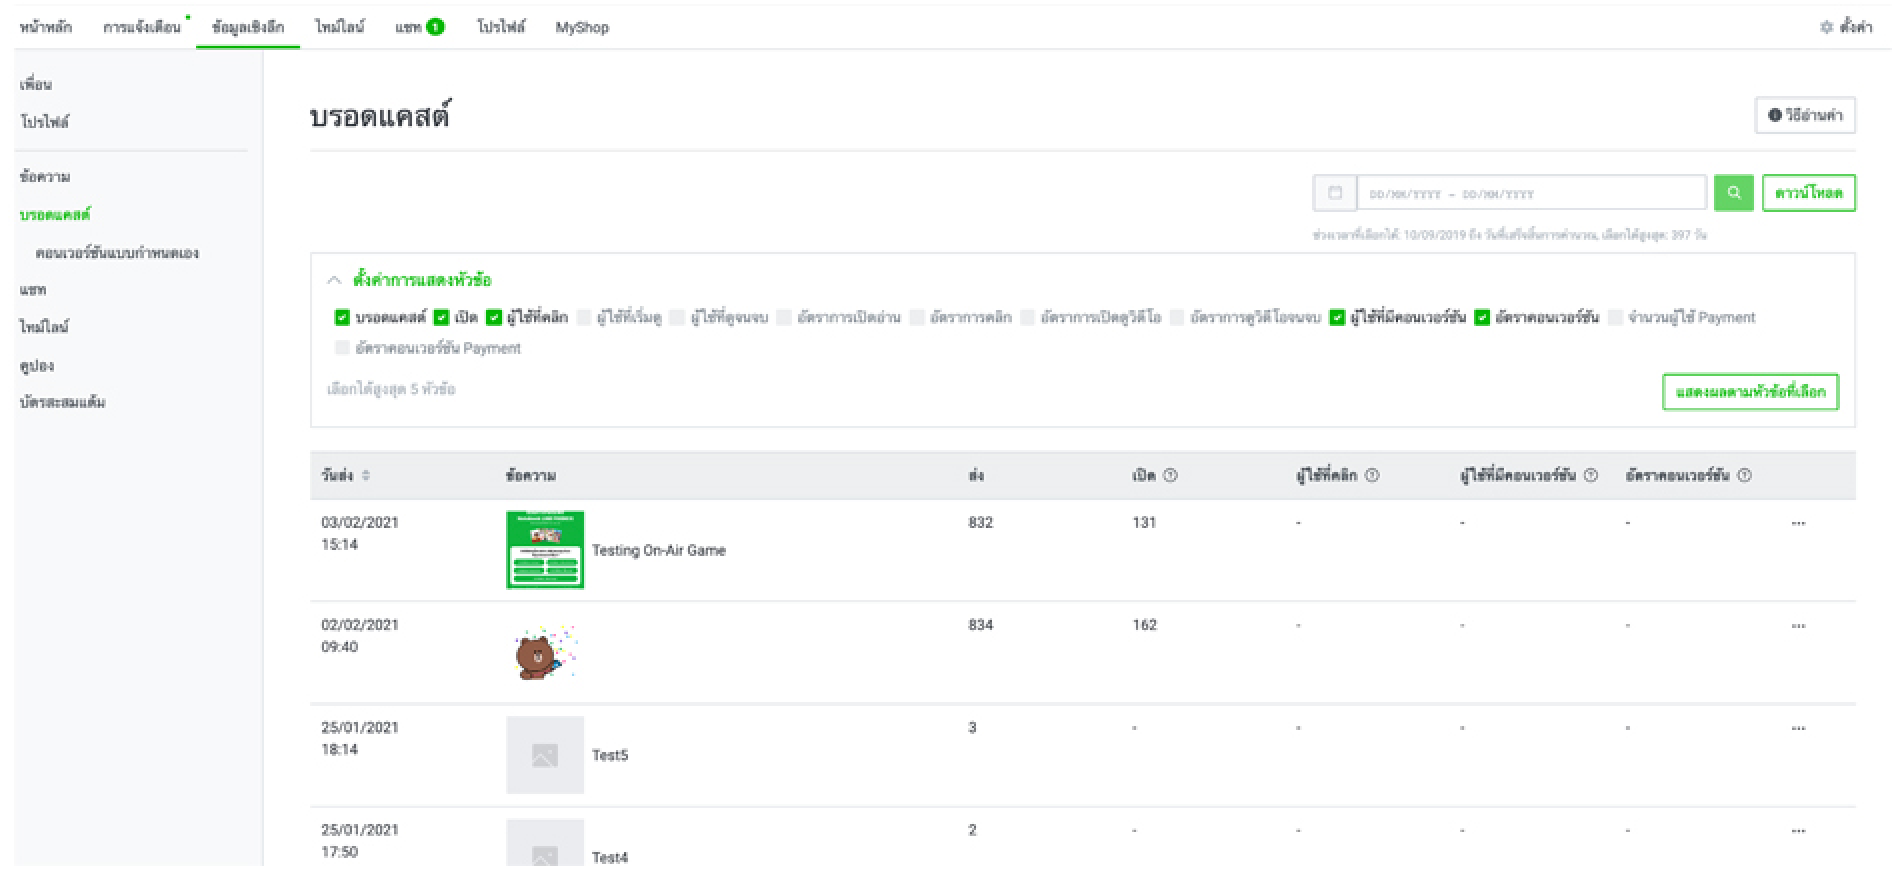
Broadcasting is the most effective LINE OA communication method and brands have high expectations for conversion when broadcasting a message. Performance Insight assists broadcasting by displaying in-depth insights on broadcasted messages for comparison, giving a clear image of what types of messages engage customers and which are ignored. Broadcast indicators include:
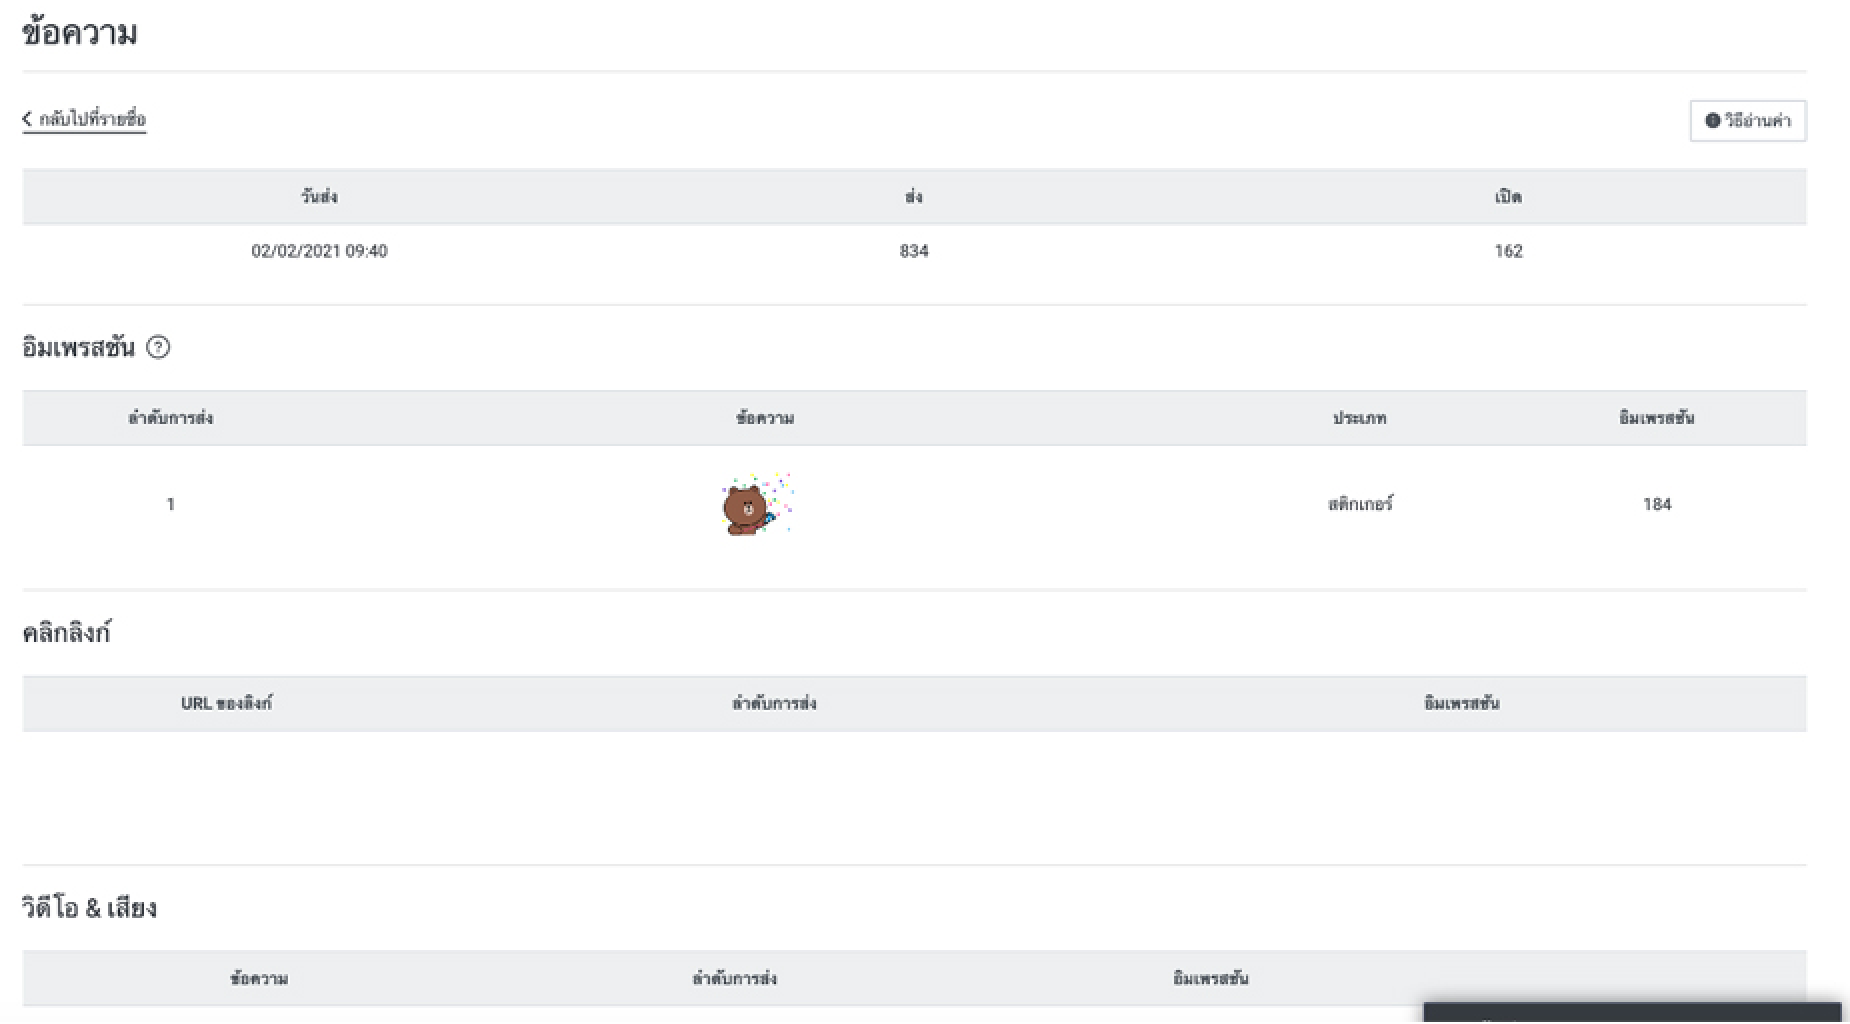
Detailed insights for each broadcast message can be viewed.
Insight: Chat
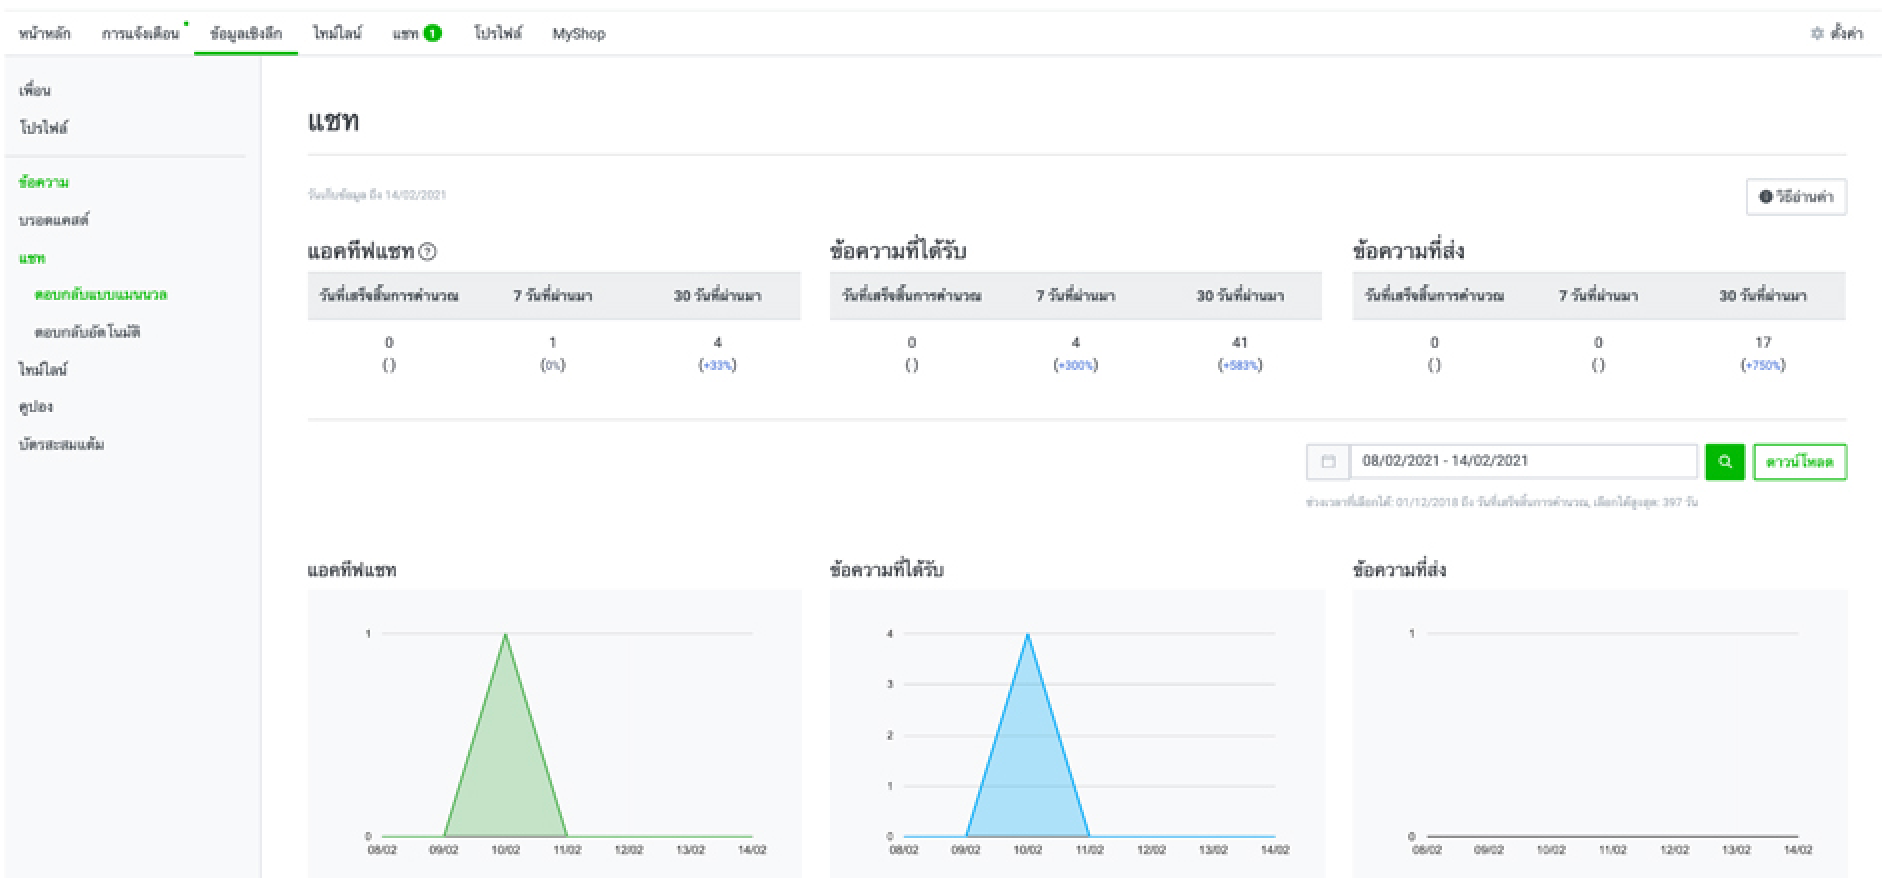
The Insight page displays chat data divided into two categories:
1.Manual Response displays 1-on-1 chats with customers.
2.Automated Response displays chats conducted by the bot
If the amount of manual responses is high and automated responses are rarely used, that is an indication that the automated responses are not addressing customer queries and should be improved for better performance based on frequently asked questions by customers.
Insight: Message
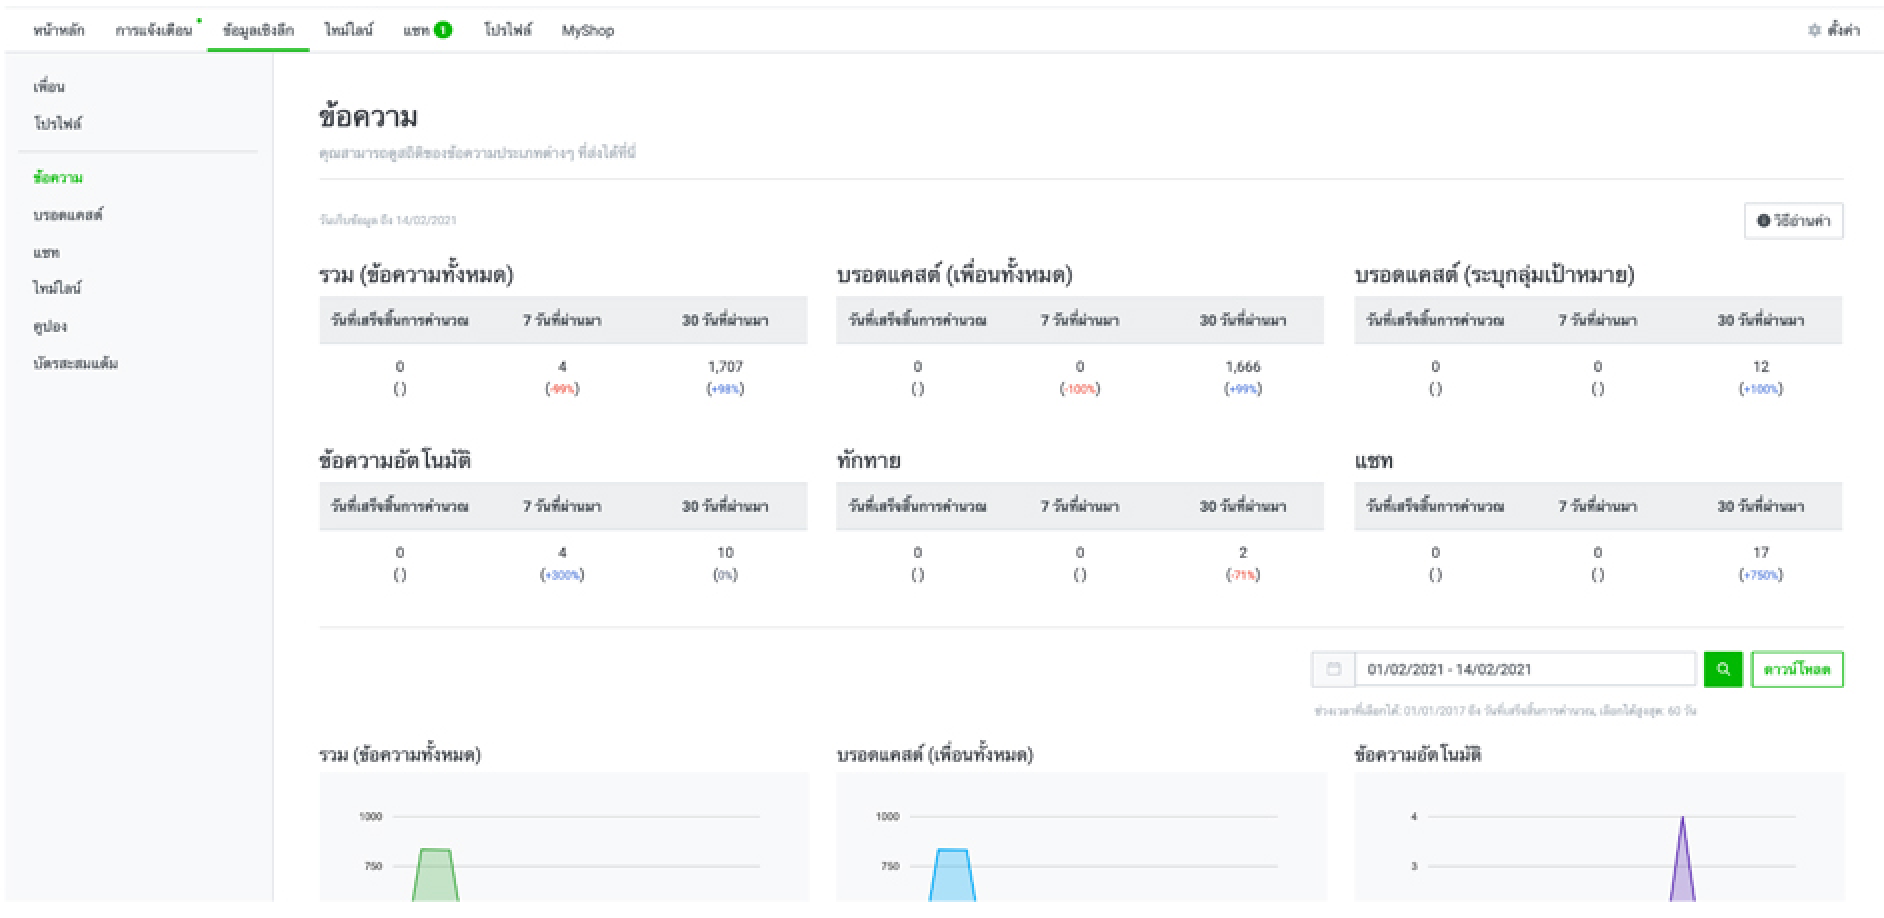
The brand can review the number of times different types of messages are sent, from broadcasts and greetings to automated response. Statistics on each type of message can help in their improvement. For example, if greetings are being sent particularly frequently, it means there has been an increase in new customers and the message should include more information about the brand, to better inform customers.
Insight: Profile
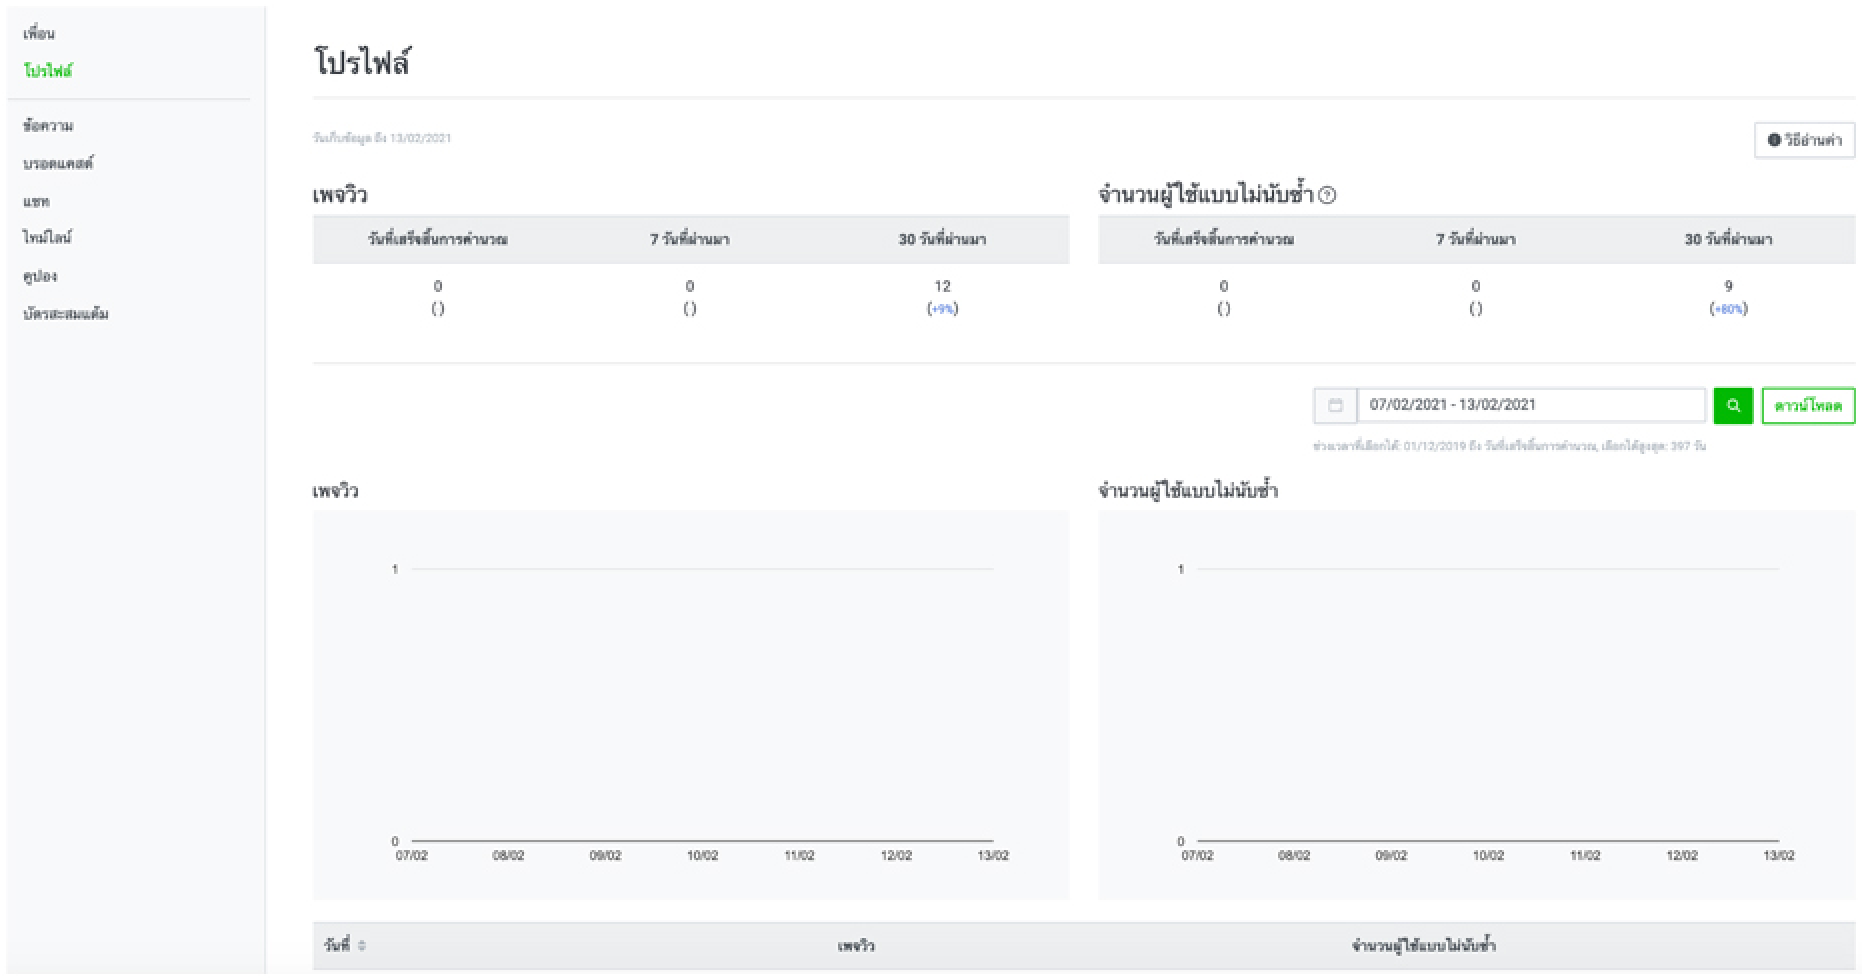
The Profile Page among the first pages to be viewed by new customers to the LINE OA, so knowing the number of page views by customers on the Profile Page can help inform what information should be displayed on the page. If views of the Profile Page are high, it should include contact channels for the brand as well as basic information addressing frequently asked questions such as the brand’s telephone number, operating hours or delivery hours.
Insight: Timeline
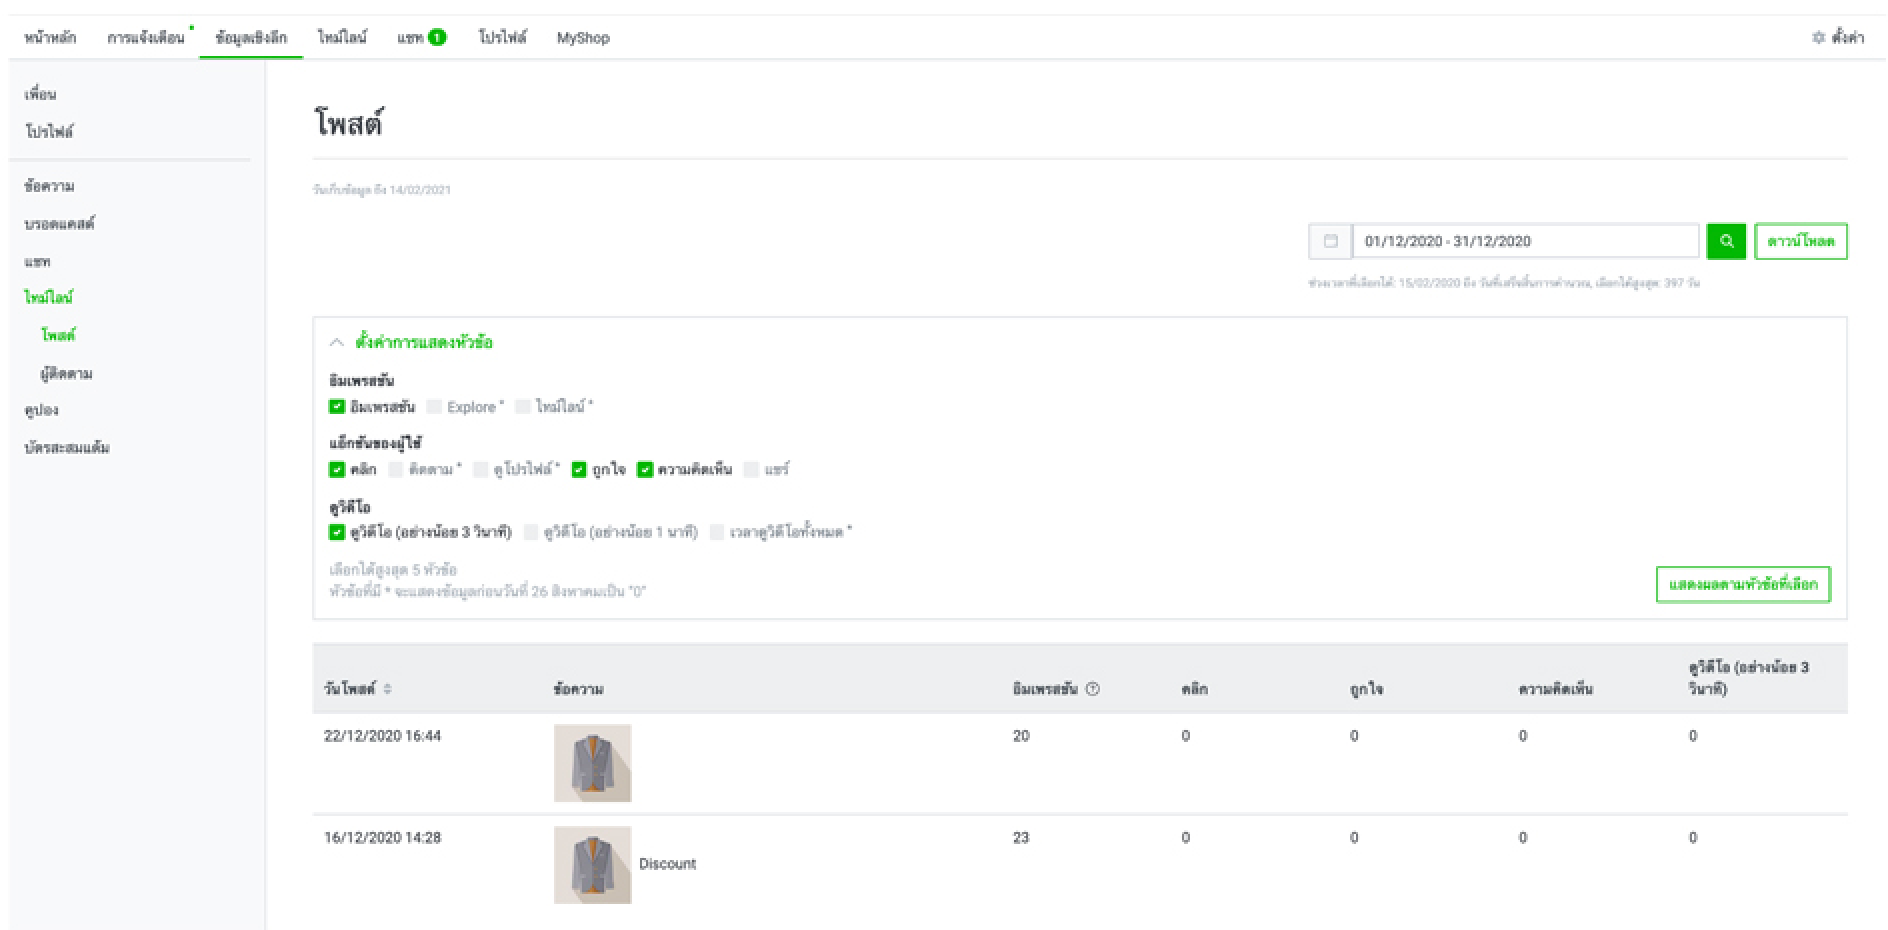
Posting content to the LINE Timeline is another method brands favor for promotion. Impressive content can result in more followers and lead to more customers. Insights on Timeline posts can be viewed to inform the types of content that should be used and what types of content should be discontinued.
Insight: Coupon
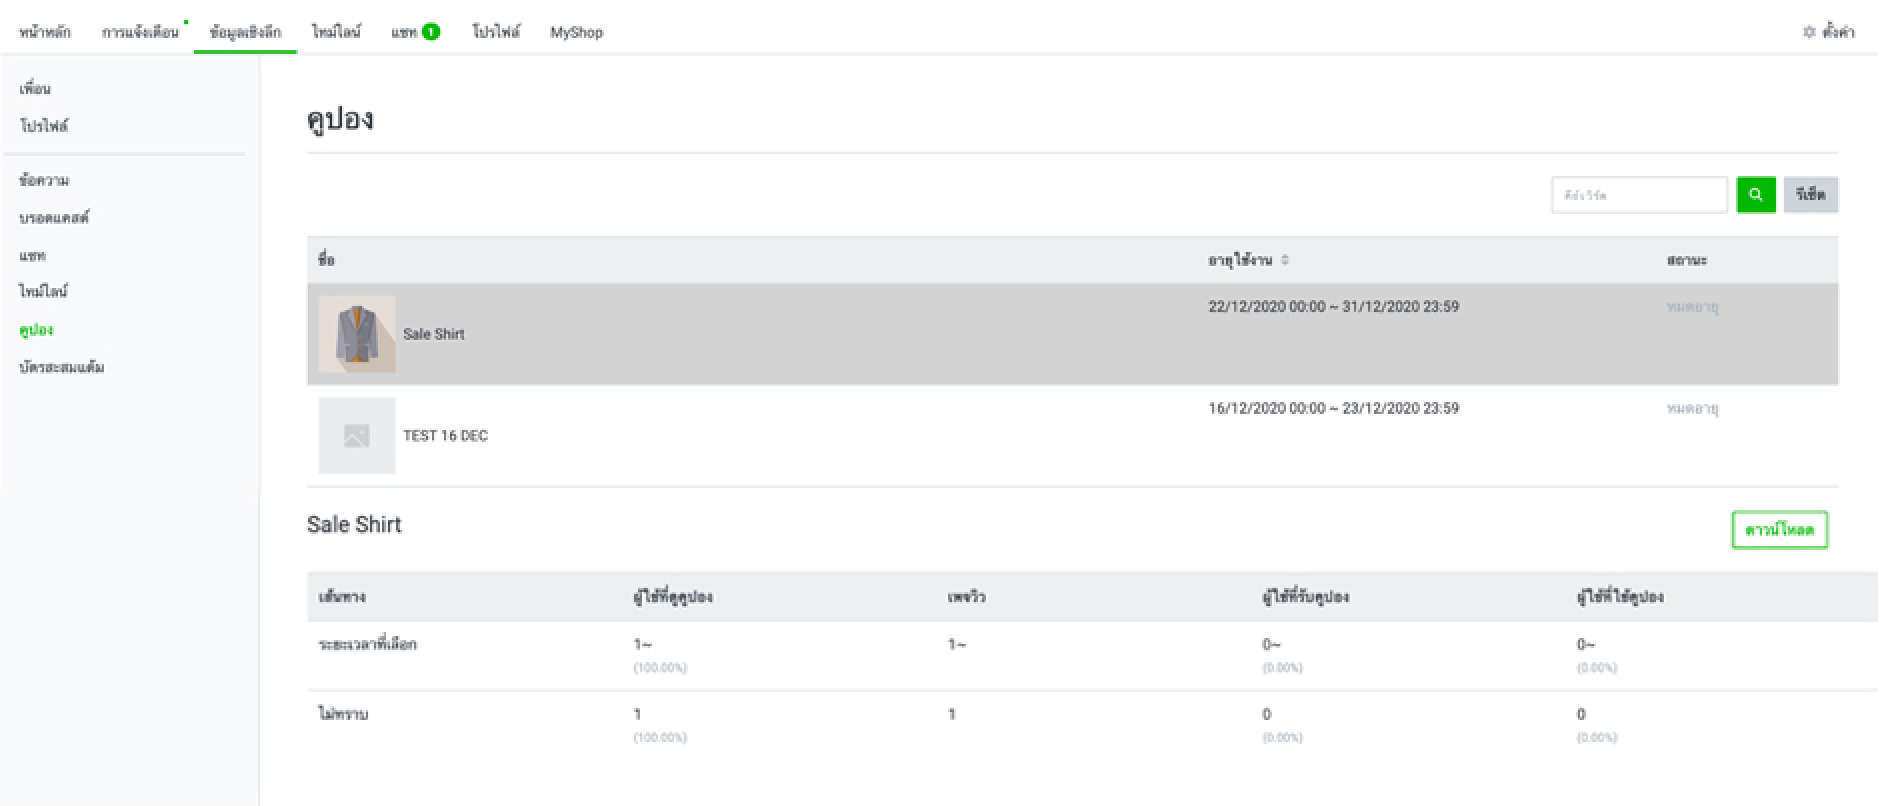
If a Coupon is distributed via LINE OA, insights on the coupon are provided, including how many users clicked to receive the coupon and the actual number of coupon users. Coupons with high rates of reception and usage can be considered well-received by customers and effective for conversion while coupons with a low rate of usage may not have met customer needs.
Insight: Rewards
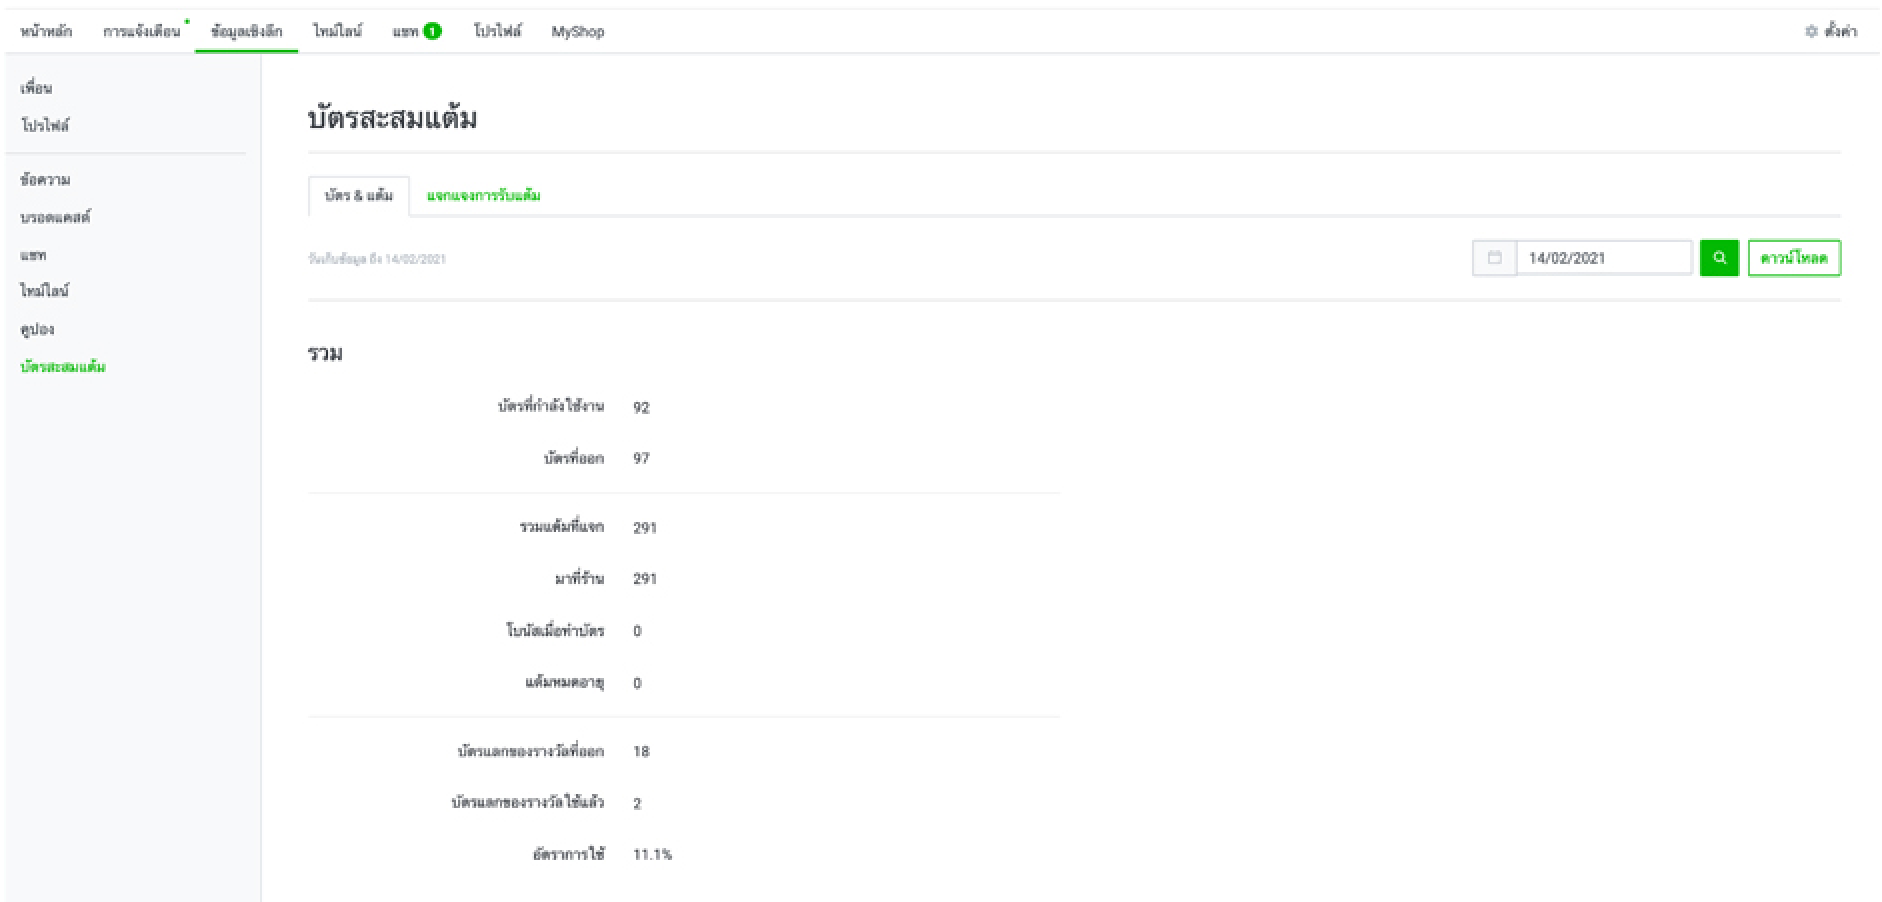
The Rewards Card is a feature that can encourage repeat business. Performance Insight can indicate if customers are responding to the Reward Card by displaying:
If statistics for these insights are low, the brand may consider revising reward rules, presenting a more attractive reward, simplifying point collection or reducing the amount of points needed for redemption.
While the benefits of Performance Insight may now be clear, the question may remain as to how the data can be applied to your business. Putting collected insights to use doesn’t have to be complicated. Take for example, a clothing business. This business can start by looking at a general insight such as Insight : Friends to gain an image of their customer base. Once finding out that most of their customers are women between the ages of 25 and 34 living in Bangkok, they might broadcast messages targeted to adult women, such as a discount celebrating payday and a pairing based on colors of the day with free shipping across Bangkok. After these messages are broadcast, the business can then view Insight : Broadcast to see which message was best received, where if the payday discount resulted in a high rate of clicks, it can be used more frequently.
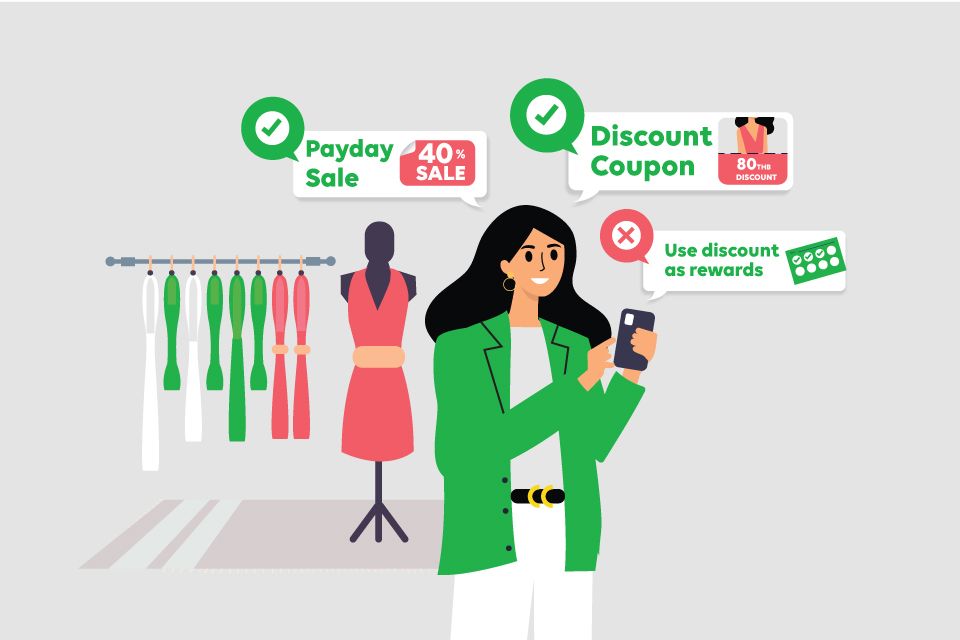
Coupons and rewards cards are also important. The business may begin by sending out a variety of coupons, 10% discounts and Free Shipping, and then viewing Insight : Coupon to find out that the discount coupon was more effective, leading to more such coupons being sent out. Rewards cards can be tested in the same way, where the business may offer a card rewarding a discount but Insight : Rewards shows a low rate of redemption, meaning a more attractive reward should be offered, such as a free dress.